The short answer
Track the share of merchants who reach each step of the funding application — landing page, revenue question, business details, phone verification, submitted — and keep the numbers month after month. The step with the biggest drop is the one to fix first, and Microsoft Clarity’s recordings show why merchants leave there. Kept over time, the same numbers catch problems nothing else would: a page-one-to-page-two rate that was 20% last January and is 10% this January is a problem you would never see without the history.
A funding application loses merchants at every step, and the total — visitors in, qualified leads out — says nothing about which step is doing the losing. A page that converts about 5% of visitors into qualified leads can be losing most of them at one question. The only way to know which is to count each page.
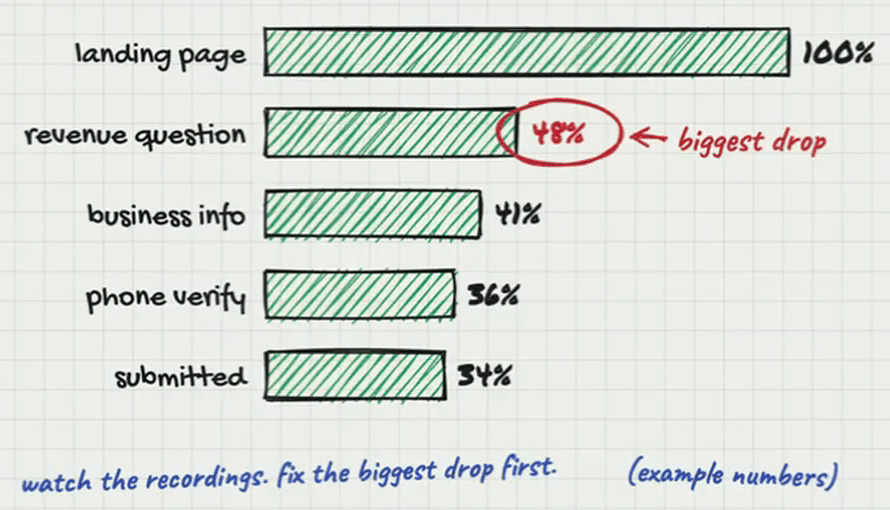
Reading the funnel
| Step | Reached it, in the example | Lost on the way to it |
|---|---|---|
| Landing page | 100% | — |
| Revenue question | 48% | 52 points, the biggest drop |
| Business info | 41% | 7 points |
| Phone verify | 36% | 5 points |
| Submitted | 34% | 2 points |
In the example, more than half of everyone leaves between the landing page and the first question, and every step after that loses a handful. Polishing the passcode step, which costs two points, is worth almost nothing next to fixing whatever happens before the revenue question. The rule on the board is the whole method: watch the recordings, fix the biggest drop first.
Where the two tools split the work
| Page-to-page rates | Microsoft Clarity | |
|---|---|---|
| What it tells you | Where merchants leave, and how many | Why: what they saw and did before they left |
| What it needs | Each step of the form counted as its own page or event | A script on the page, about a five-minute install |
| What it catches | A step that has got worse over time | A broken button, a confusing field, a page that fails on a phone |
Clarity records every session, submitted or abandoned, so you can see whether something in the funnel is broken. The page-to-page numbers tell you which recordings to watch: filter to the merchants who left at the biggest drop and the reason is usually visible within a few sessions. That is how the bank statement upload came off our own application.
Keep the history
The part most brokers skip is keeping the numbers. Alex’s example — an example, not a measurement — is a page-one-to-page-two rate of 20% last January and 10% this January. Nothing in a single week’s data would show that, and a rising cost per lead has a dozen other suspects. With the history it is one step that halved, and one step can be fixed. Without it you are shooting in the dark.
It is the fourth of five essentials in the video, and the one Alex singles out at the end as the thing to go and build. When the biggest drop turns out to be a step that removes real merchants rather than unwanted ones, it is bad friction, and the fix is usually to take it out.